
While growth in the organic industry has slowed, U.S. consumers are not giving up on organic food. Organic sales, which expanded at a rate of 20 percent per year from the early 1990s through 2007, likely experienced negative growth in 2009. But 31 percent of U.S. families bought more organic food in 2009 than in 2008.
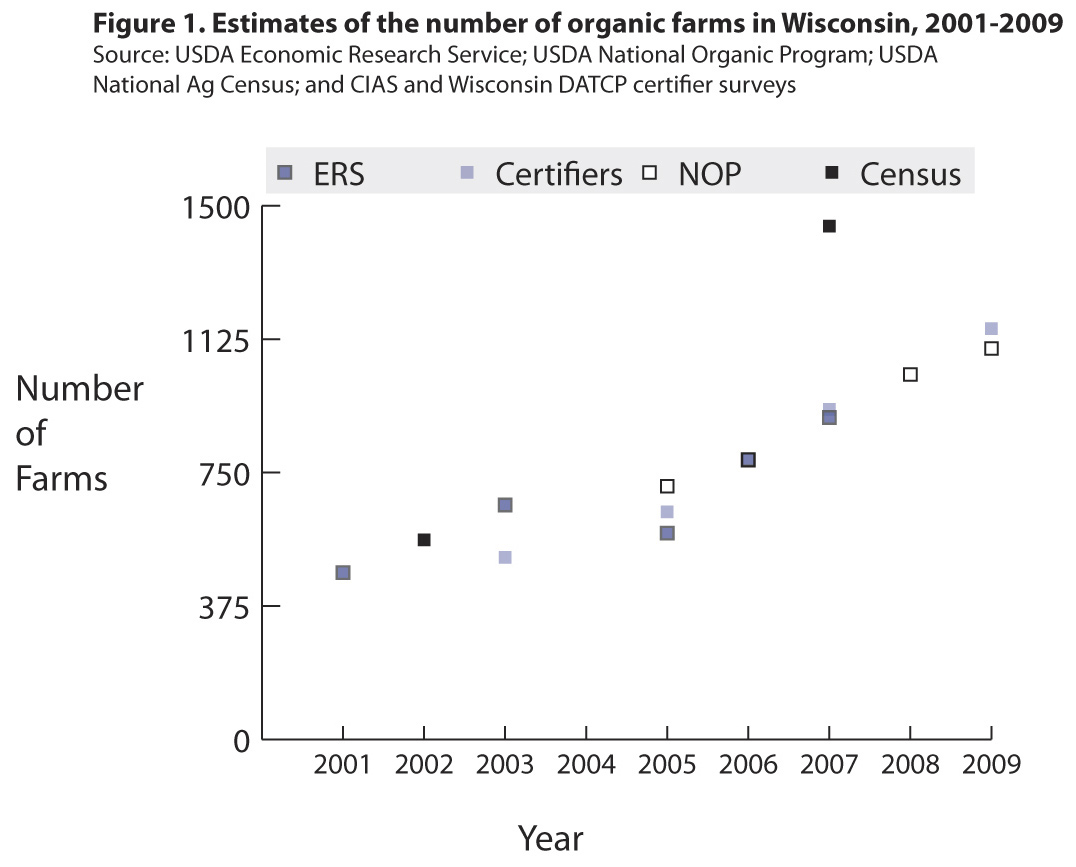
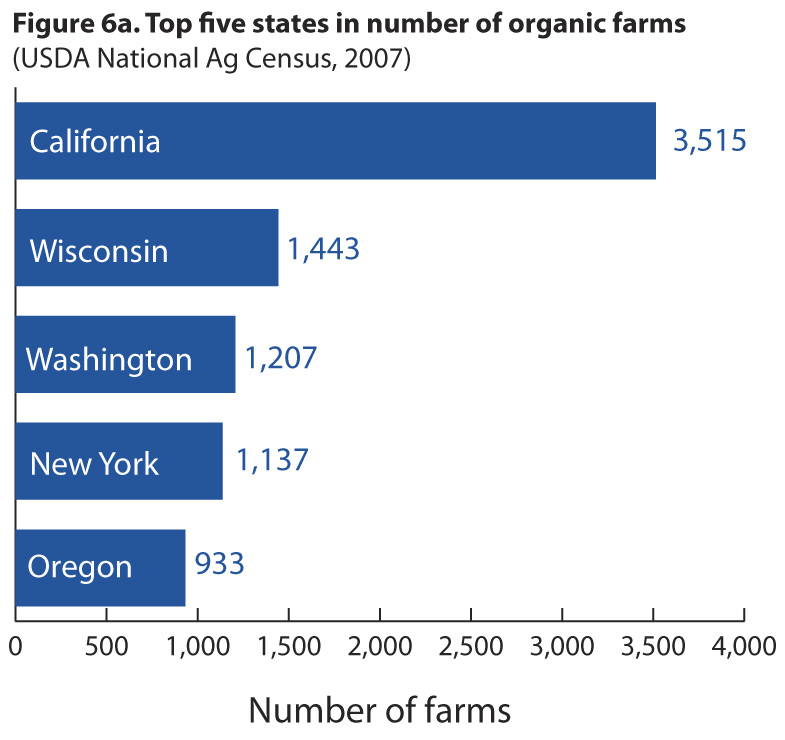
Wisconsin is a top-ranked state in organic agriculture. Since 2002, Wisconsin has ranked second only to California for the total number of organic farms in the United States. The 2007 Census of Agriculture found that Wisconsin had 1,443 certified and uncertified organic farms. In 2009, the USDA National Organic Program listed 1,026 certified organic farms in Wisconsin.
Despite the recession, the outlook for Wisconsin’s organic industry is positive. Wisconsin organic dairy farms with favorable financial performance in 2009 are likely to perform well in 2010. The coming year could bring an upswing in the market for organic feed grains, due to weather-related crop issues in 2009.
Read the full report (PDF)
Download figures from this report:
Figure 1: Estimates of the number of organic farms in Wisconsin, 2001-2009
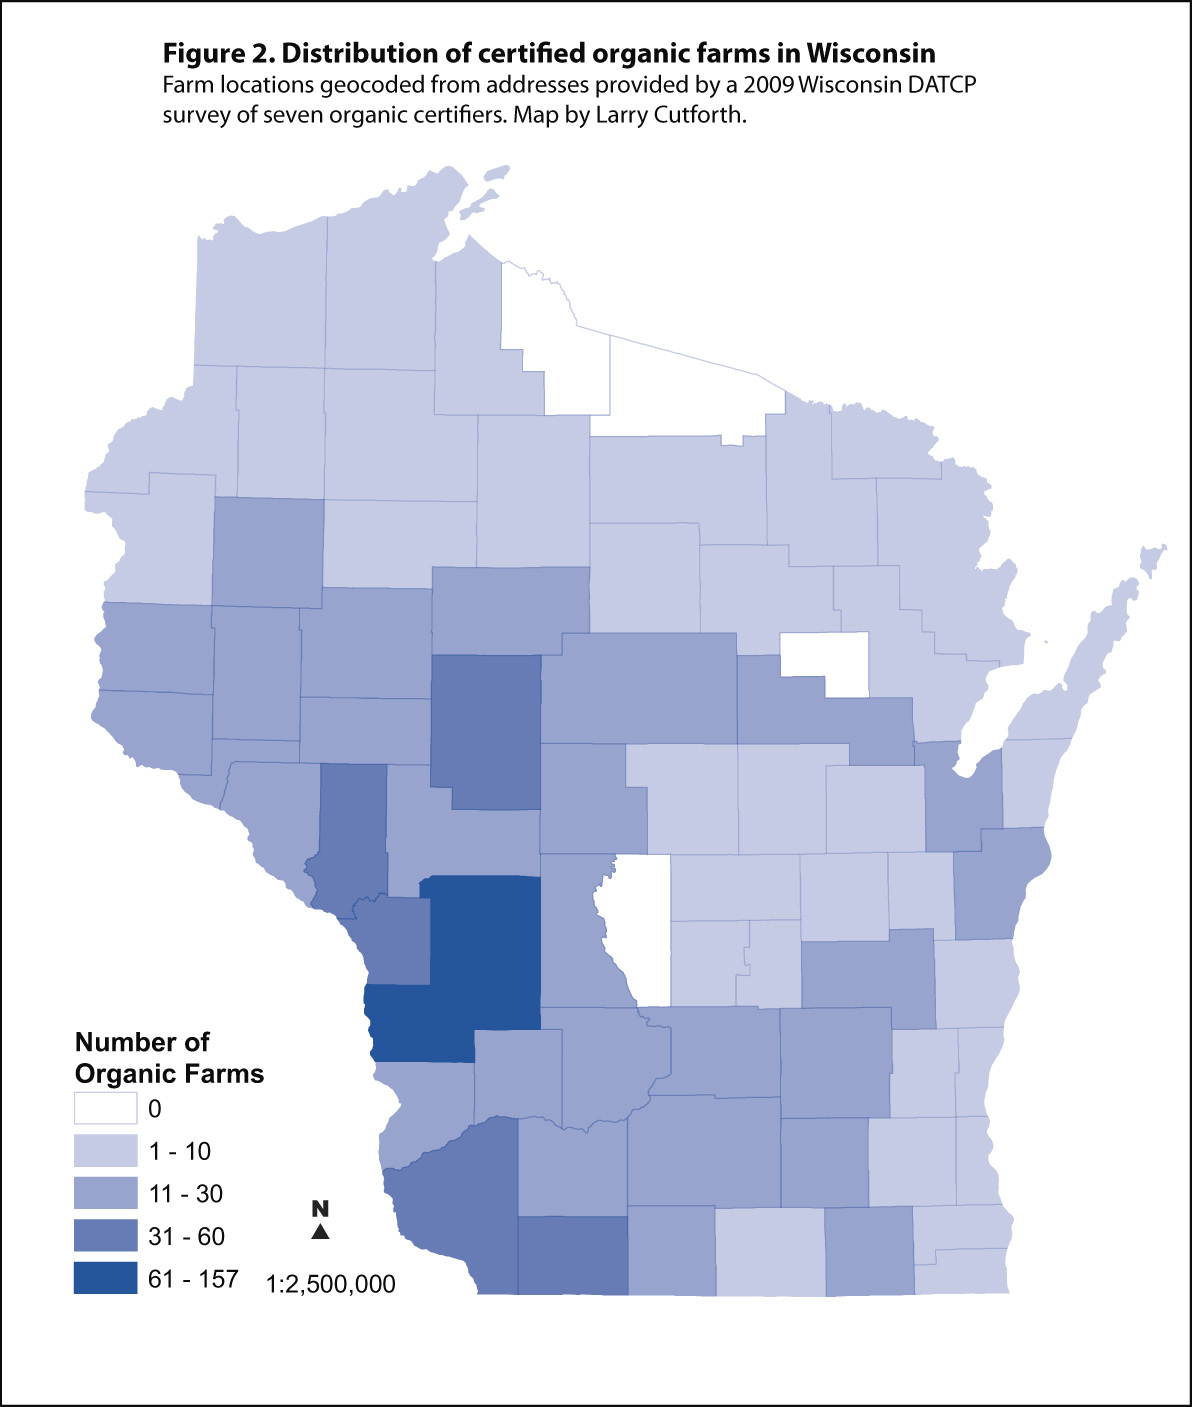
Figure 2: Distribution of certified organic farms in Wisconsin
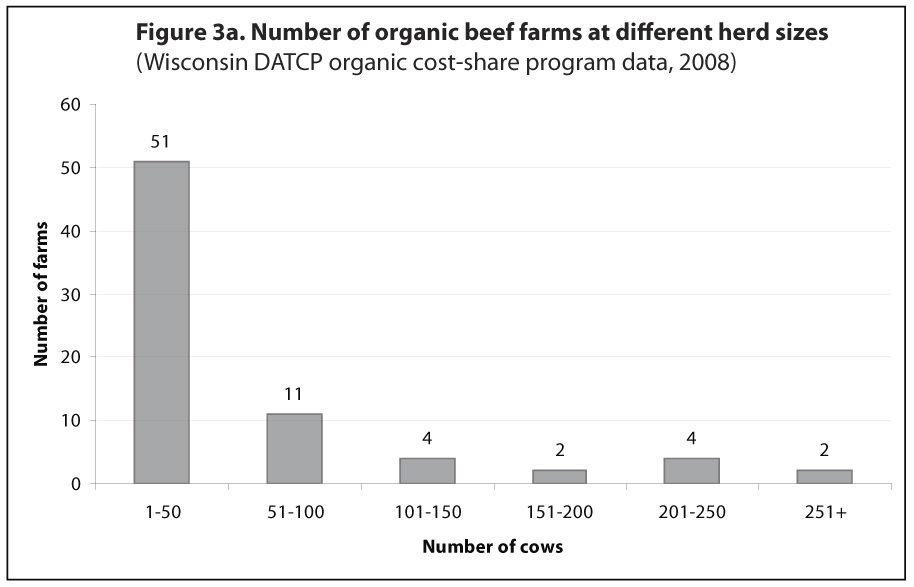
Figure 3a: Number of organic beef farms at different herd sizes
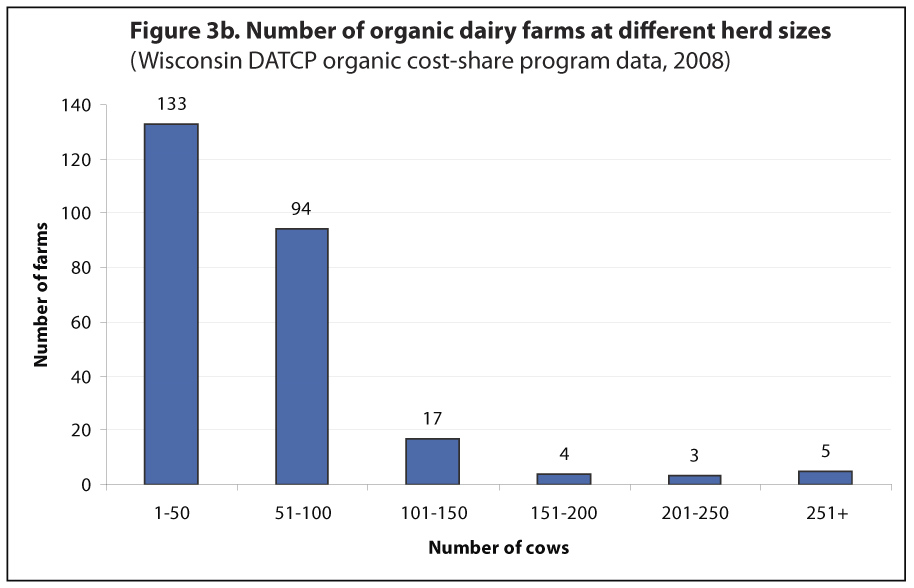
Figure 3b: Number of organic dairy farms at different herd sizes
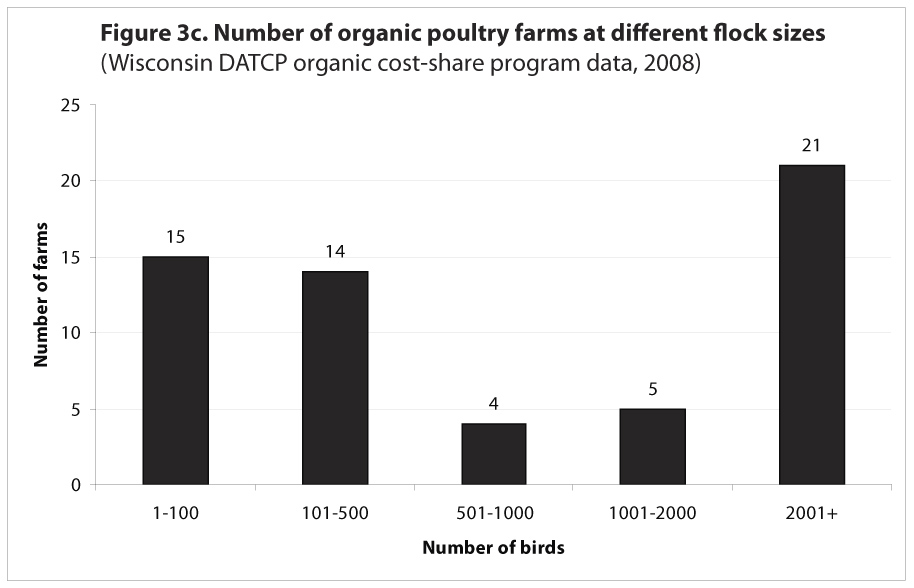
Figure 3c: Number of organic poultry farms at different flock sizes
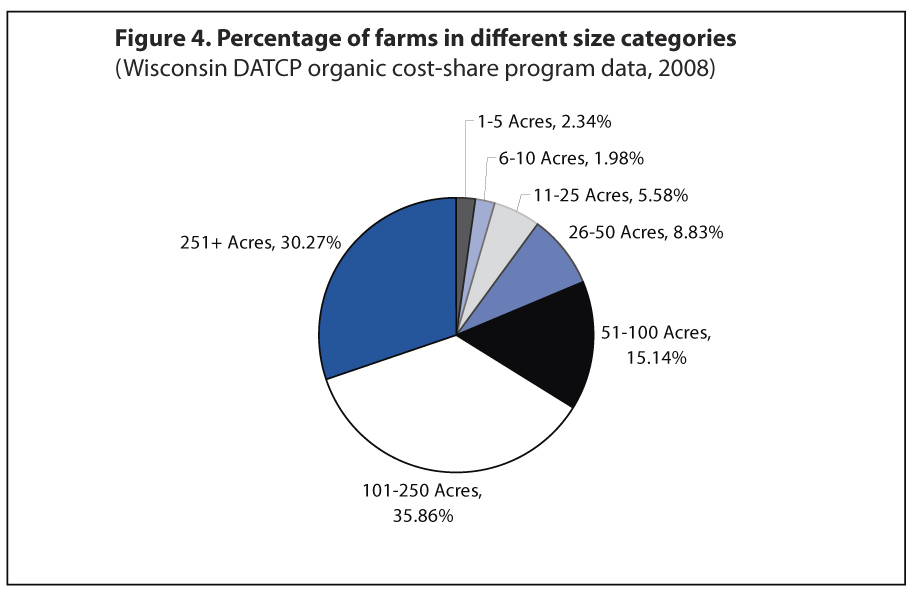
Figure 4: Percentage of farms in different size categories
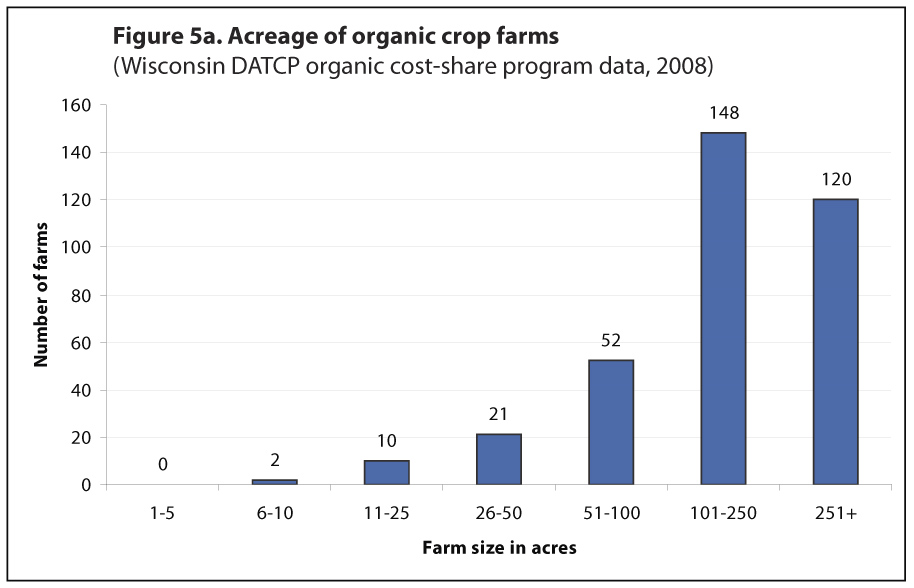
Figure 5a: Acreage of organic crop farms
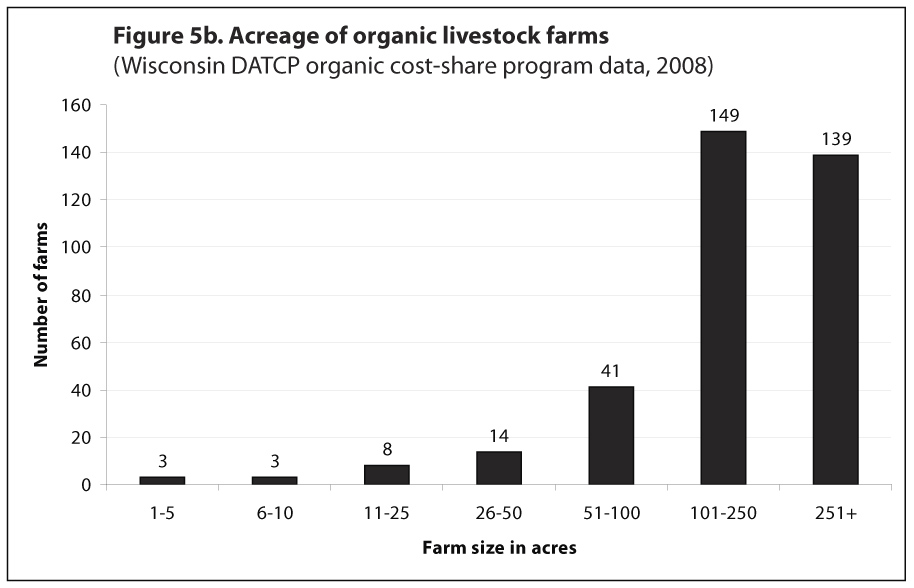
Figure 5b: Acreage of organic livestock farms
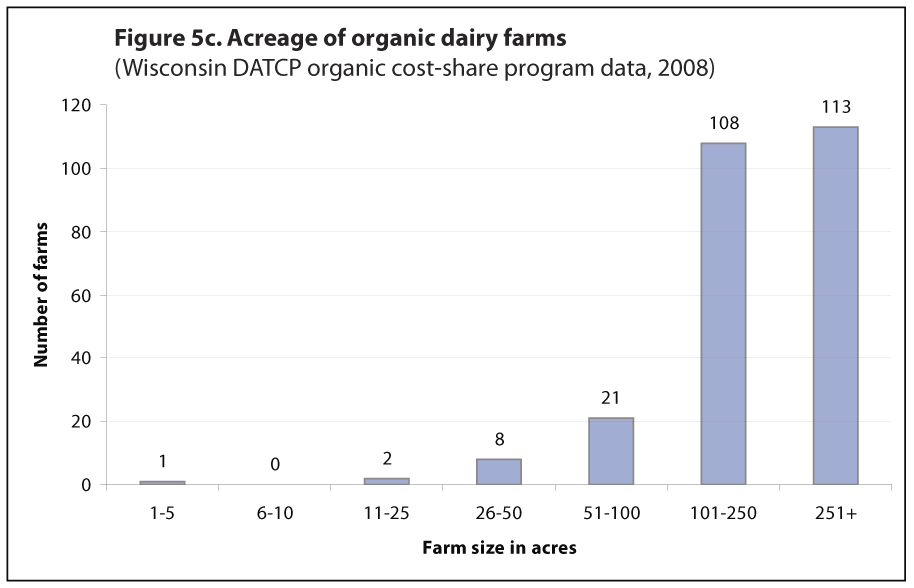
Figure 5c: Acreage of organic dairy farms
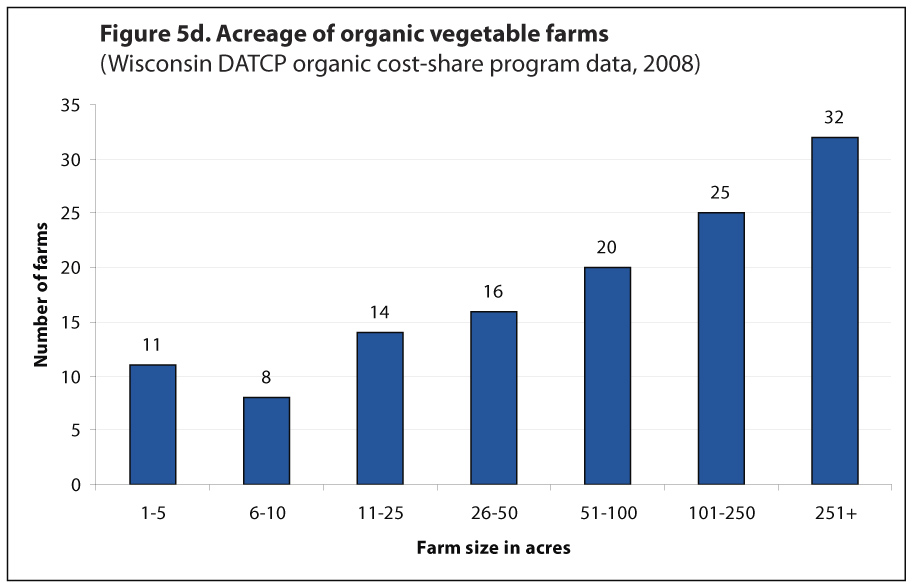
Figure 5d: Acreage of organic vegetable farms
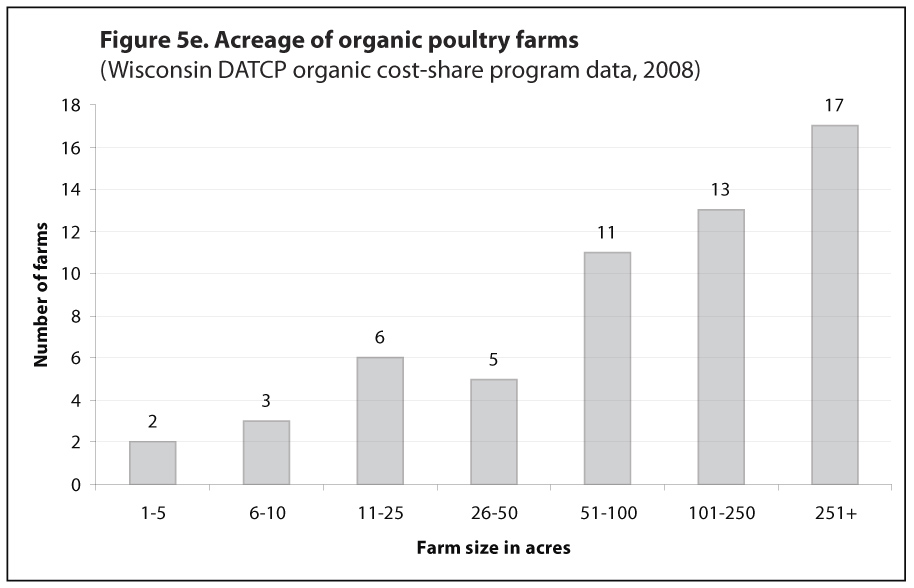
Figure 5e: Acreage of organic poultry farms
Figure 6a: Top five states in number of organic farms
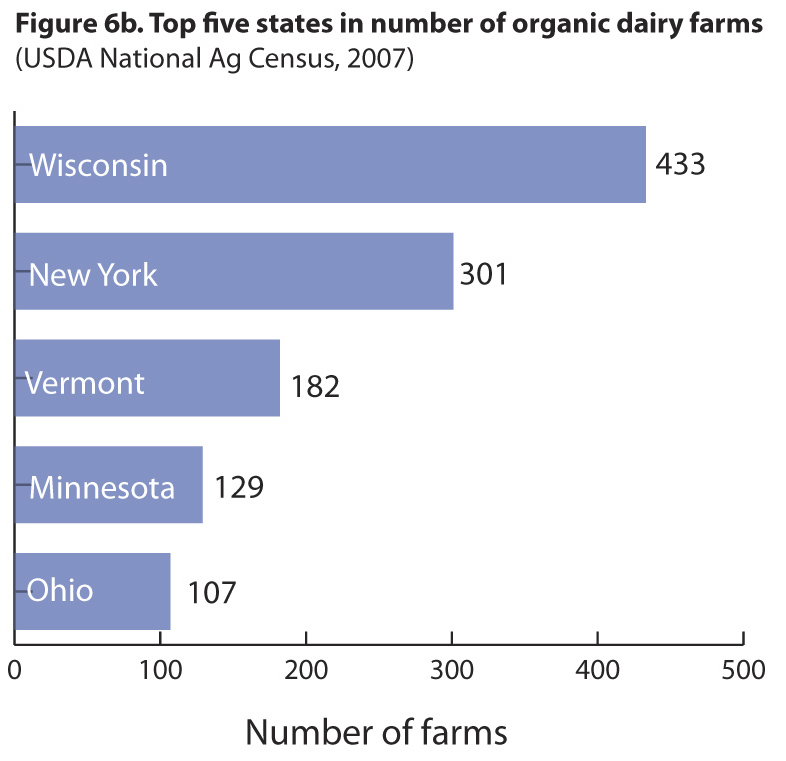
Figure 6b: Top five states in number of organic dairy farms
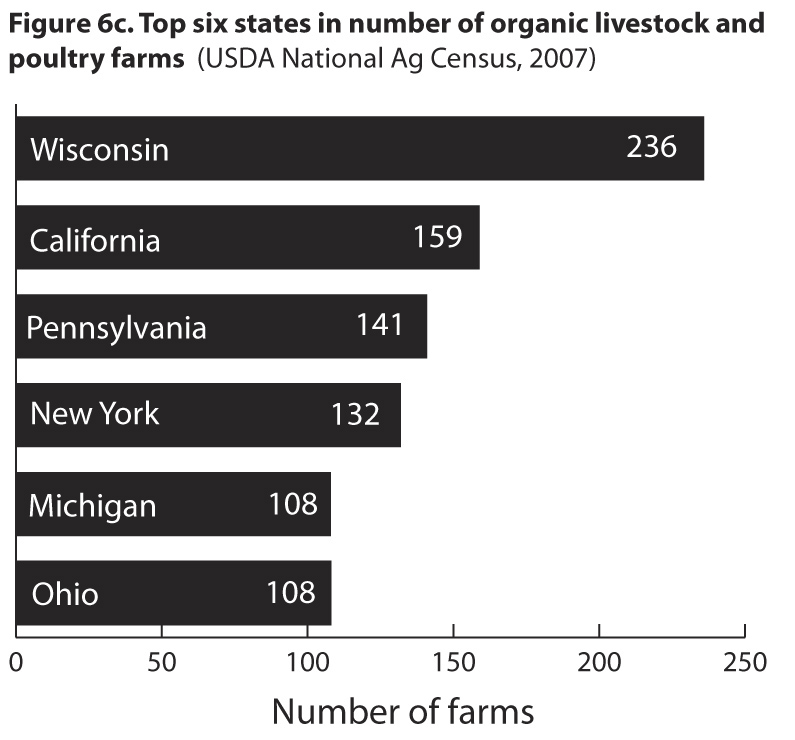
Figure 6c: Top six states in number of organic livestock and poultry farms
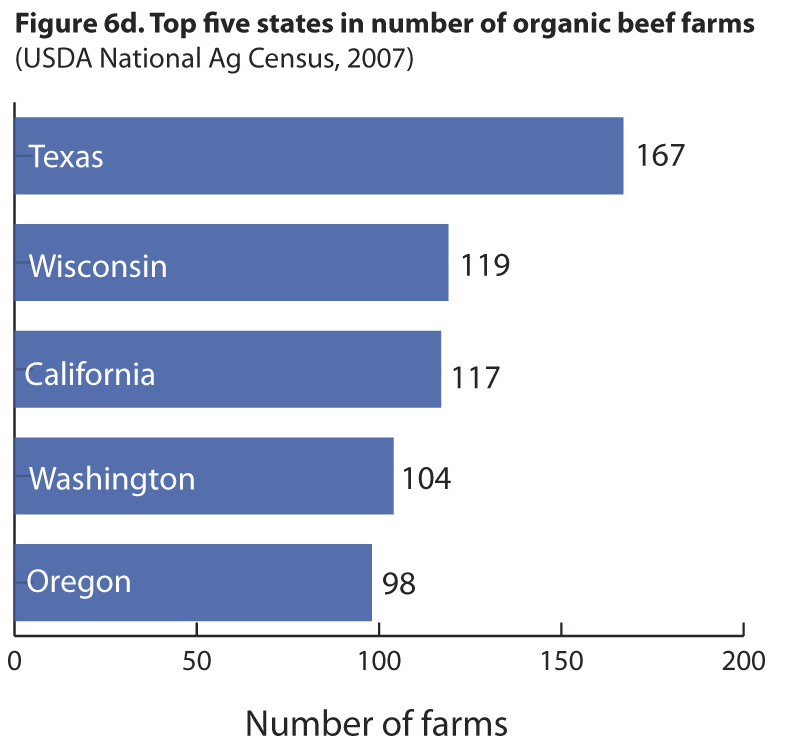
Figure 6d: Top five states in number of organic beef farms
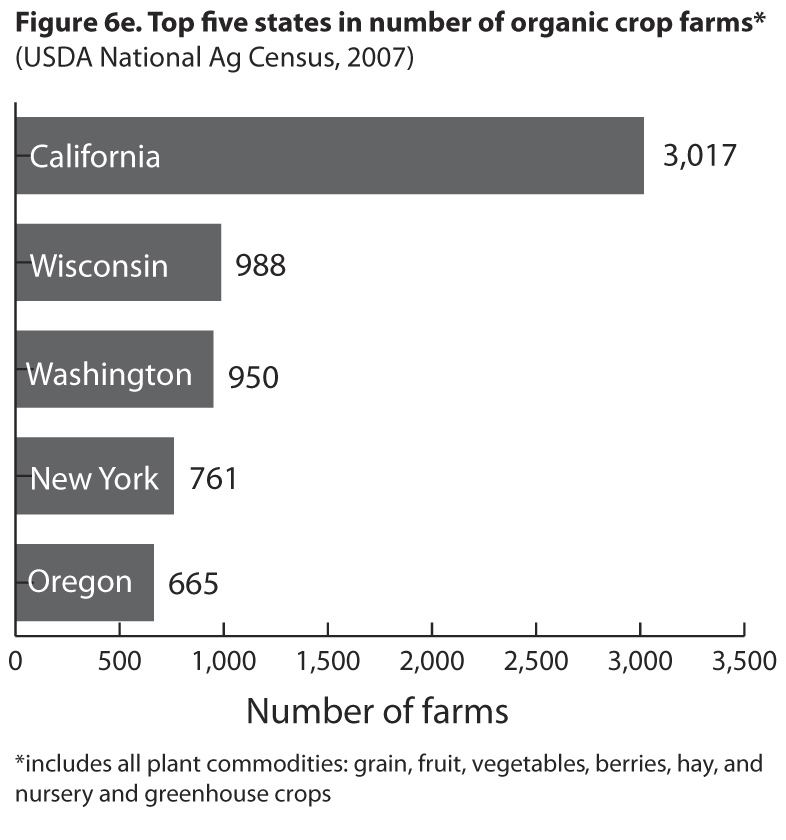
Figure 6e: Top five states in number of organic crop farms
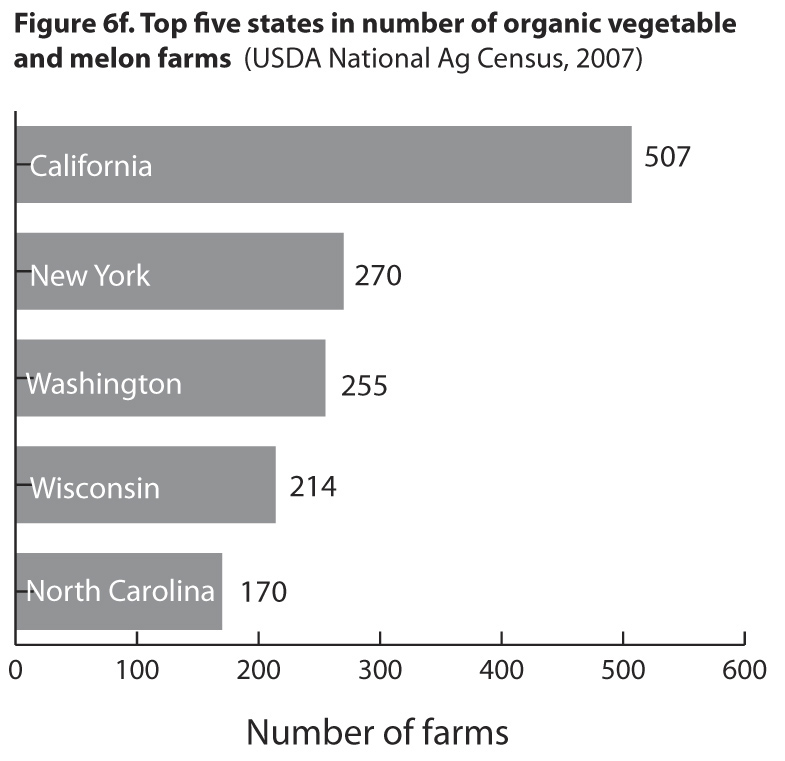
Figure 6f: Top five states in number of organic vegetable and melon farms
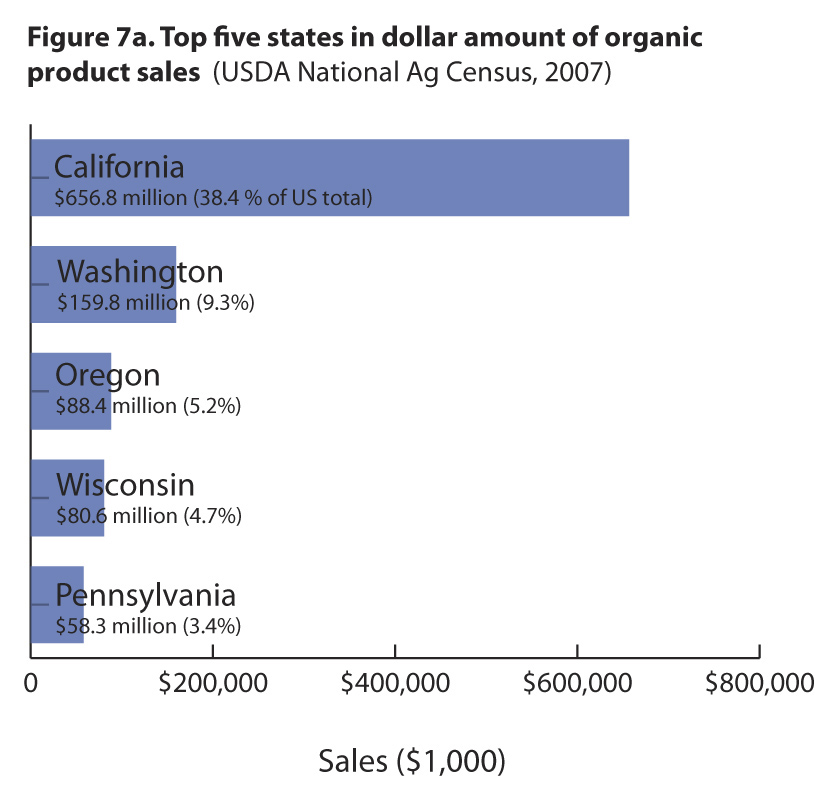
Figure 7a: Top five states in dollar amount of organic product sales
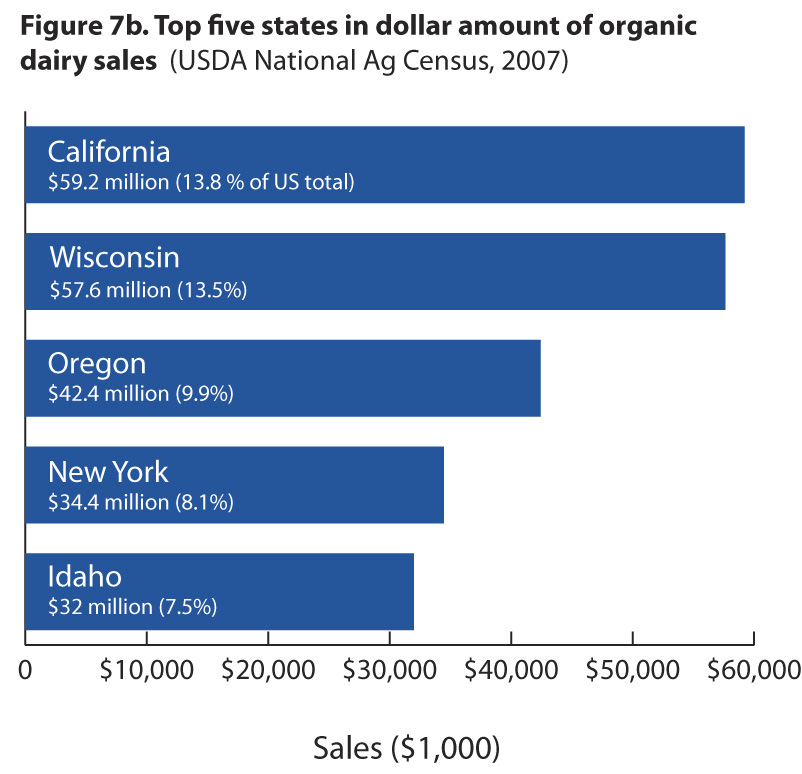
Figure 7b: Top five states in dollar amount of organic dairy sales
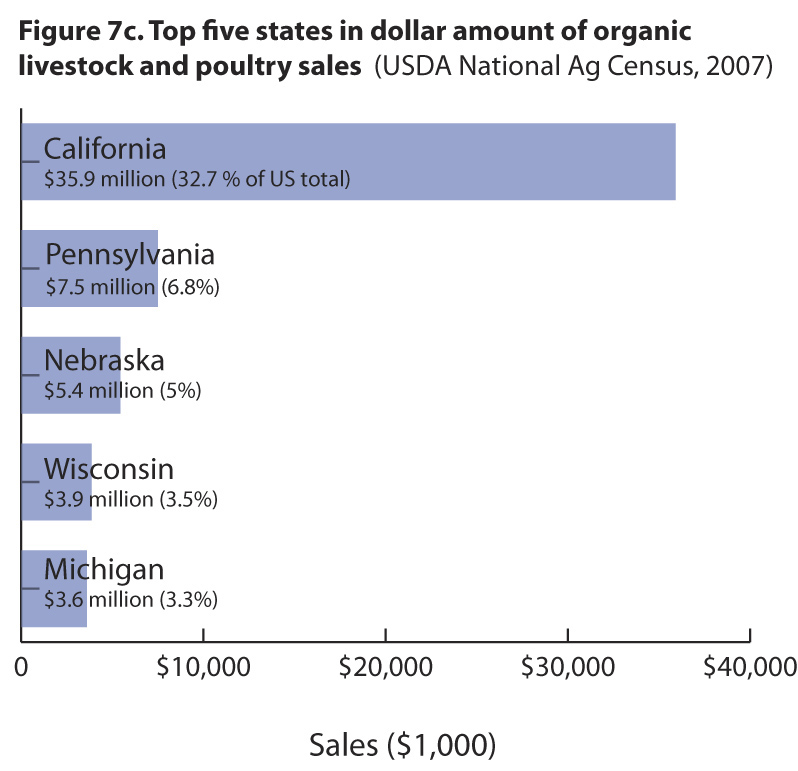
Figure 7c: Top five states in dollar amount of organic livestock and poultry sales
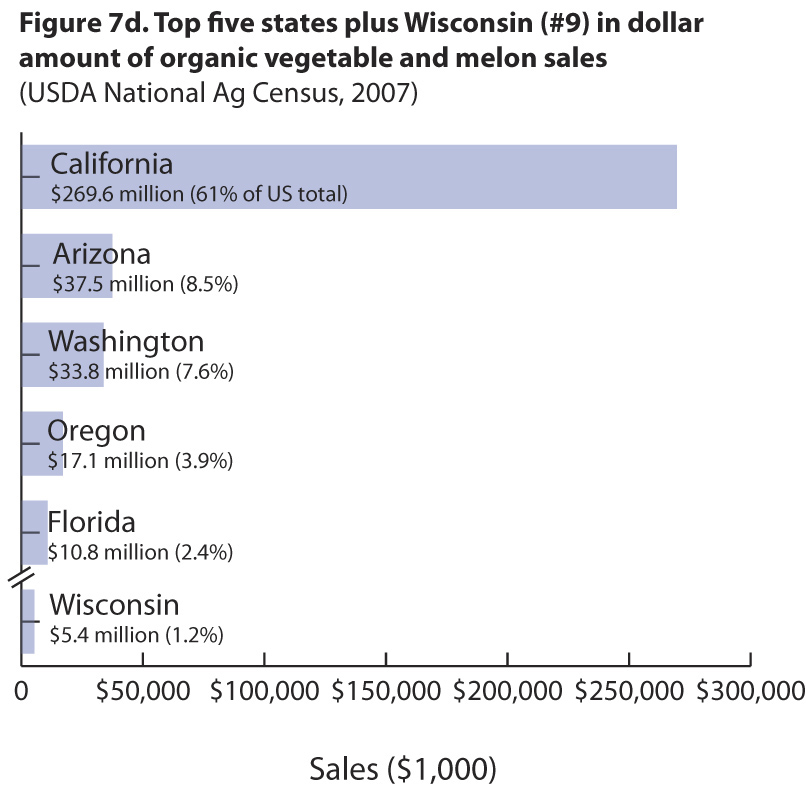
Figure 7d: Top five states plus Wisconsin (#9) in dollar amount of organic vegetable and melon sales
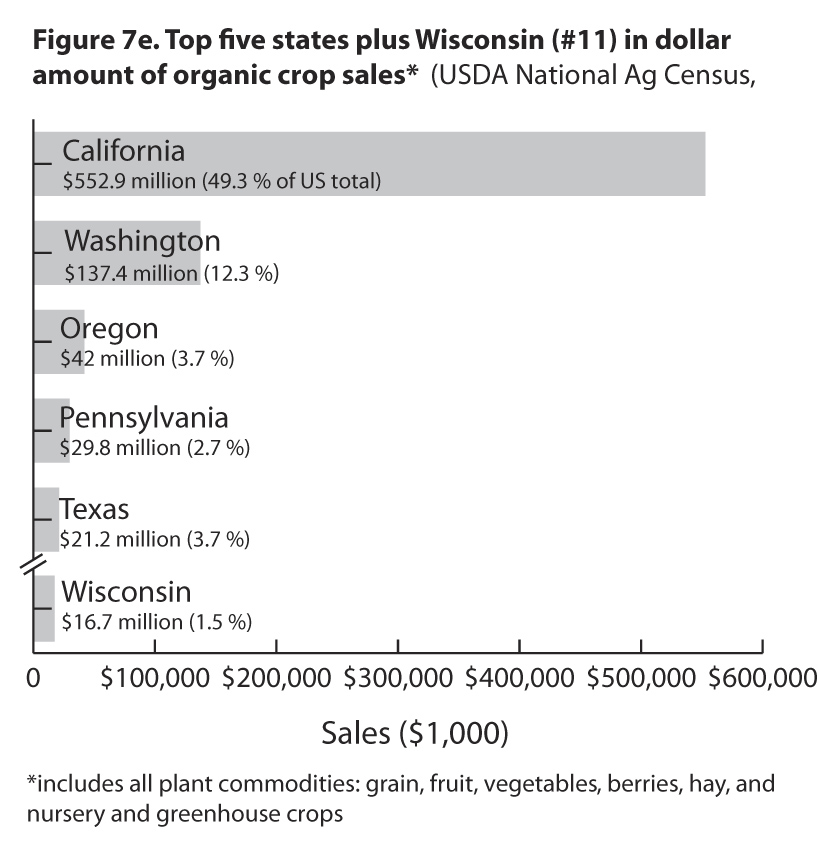
Figure 7e: Top five states plus Wisconsin (#11) in dollar amount of organic crop sales
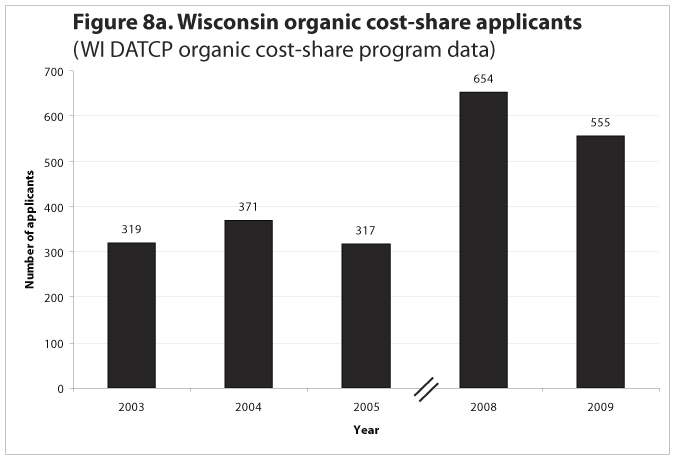
Figure 8a: Wisconsin organic cost-share applicants
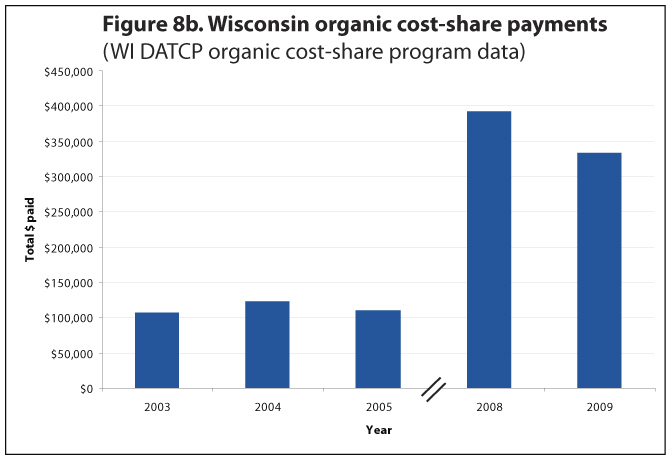
Figure 8b: Wisconsin organic cost-share payments
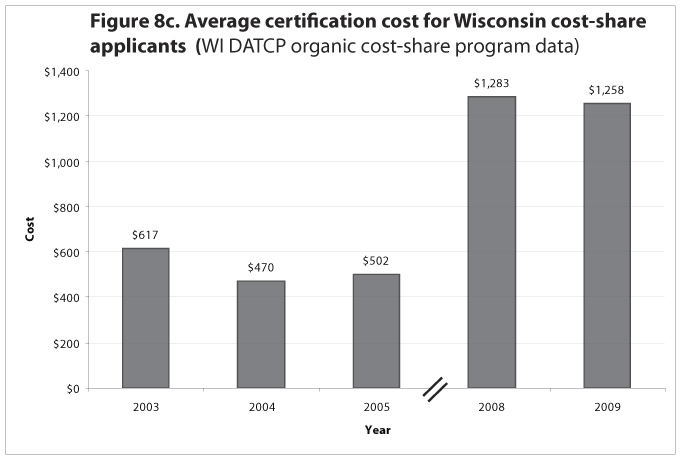
Figure 8c: Average certification cost for Wisconsin cost-share applicants
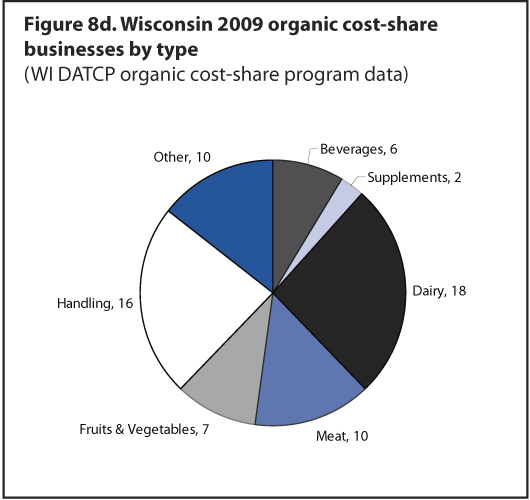
Figure 8d: Number and type of Wisconsin 2009 organic cost-share businesses