Food Flows and Digital Twins: Making Food Network Information Actionable (Summary)

Food flows and digital twins: making food network information actionable
with Dr. Kushank Bajaj, United Nations Food and Agriculture Organization
Dr. Bajaj presented a comprehensive overview of his research on mapping global and domestic food supply chains to identify systemic vulnerabilities and climate-related risks. The webinar, the third in the “Food Systems and AI” series, involved 42 participates and was hosted by the Center for Integrated Agricultural Systems (CIAS) and the National Science Foundation’s AI Institute, ICICLE. Dr. Bajaj’s work focuses on moving beyond the “black box” of proprietary supply chain data to create open-access tools that empower policymakers and communities.
The Data Paradox: Mapping the Invisible
Dr. Bajaj opened the presentation by highlighting a fundamental challenge in food systems research: the lack of high-fidelity, public data on how food moves from production to consumption. While production and trade data exist at aggregate levels, the specific pathways—the “food flows”—are often proprietary or owned by private organizations. This data gap is particularly acute in Canada and low-income regions, where infrastructure for tracking commodity-level movement is limited.
His research philosophy centers on bridging this gap between academic research and real-world practice. He argued that meaningful solutions to social problems emerge through collaboration and transdisciplinary thinking, rather than through technical reports alone. Both projects he discussed—Canada Food Flows and the Global Food Twins—are designed to make these invisible flows actionable and visible for public benefit.
Canada Food Flows: Resolving the “Middle” of the Supply Chain
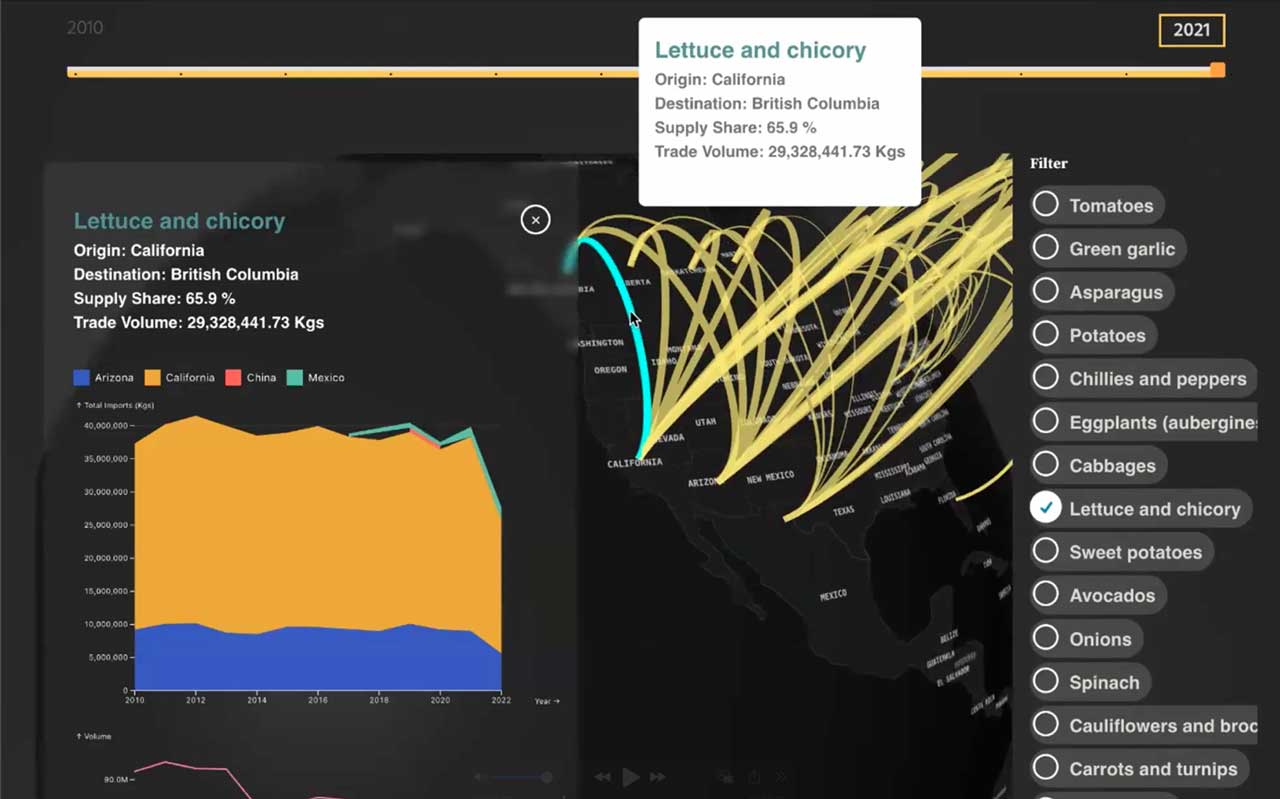
The Canada Food Flows project is a data product developed during Dr. Bajaj’s PhD work at the University of British Columbia. The tool traces the movement of fruits and vegetables from international and domestic sources to specific Canadian provinces over time.
The focus on fruits and vegetables was intentional, as they are essential for healthy diets, yet 70-80% of Canadians fail to meet the recommended intake targets. Research suggests that price volatility is a primary barrier to consumption. Canada is highly import-dependent for these staples, importing 80% of its fruits and 60% of its vegetables. However, Dr. Bajaj emphasized that “import dependence is never the biggest problem; it’s more so how concentrated the supply chains are”.
Methodological Innovations
To build this dataset, Dr. Bajaj had to overcome a significant lack of public freight data. He utilized provincial-level production and bilateral trade data, which often only recorded
where food entered the country (e.g., the Port of Vancouver) rather than where it was consumed. To resolve these interprovincial flows, he employed:
- Spatial-Economic Optimization: Using linear programming to estimate the most likely routes food takes based on transportation costs and population centers.
- Commodity-Level Disaggregation: Moving beyond aggregate “food” categories to map specific items like avocados, apples, and lettuce.
- Dynamic Visualization: An interactive open-access platform (CanadaFoodFlows.ca) that allows users to see how supply sources have shifted over decades.
Embedded Climate Risks and Price Impacts
The research used this spatial data to quantify “cross-border climate risks”. By correlating historical weather shocks in production regions (like California’s Central Valley) with retail prices in Canadian cities, he identified a direct link between international climate events and domestic food security.
Utilizing a “Super Post Epoch” analysis, the study found that extreme heat stress events in major supplying regions led to significant price spikes in Canada:
- Lettuce prices increased by an average of 35%.
- Cauliflower prices increased by 29%.
- Apple prices, conversely, showed a 8% decrease, which Dr. Bajaj noted could be a result of market gluts or quality issues.
He also mapped future exposure using downscaled climate models (CMIP6), finding that regions Canada depends on for over 50% of its produce—including Brazil, Mexico, and the Pacific Southwest—face significant threats from extreme heat.
Systemic Fragility
A powerful real-world “stress test” for these models occurred during the US-Canada tariff and retaliatory tariffs in 2025. This event highlighted the fragility of highly concentrated supply chains. Dr. Bajaj noted that organizations like the BC Trucking Association have used this data to advocate for more resilient infrastructure and to caution against retaliatory trade policies that could further stress these thin margins.
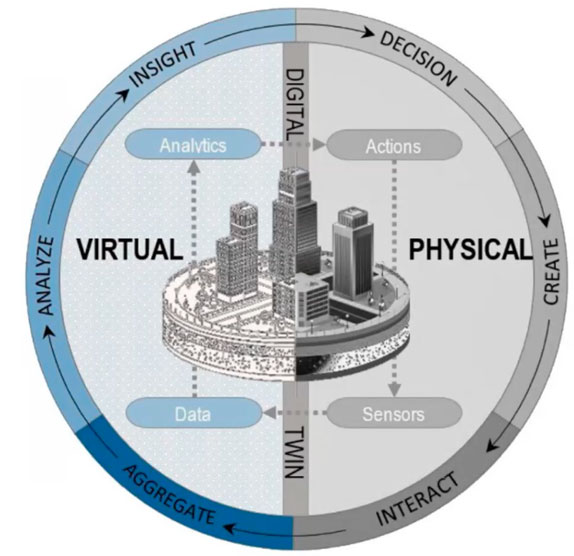
Global Food Twins: Stress Testing at Scale
The second major project, the Global Food Twins, is an open-access initiative designed for modeling and stress-testing global food systems by creating a dynamic, virtual replica of the physical world. Developed by the Better Planet Laboratory, University fo Colorado Boulder in collaboration with Earth Genome, Delft University and Development Seed, this “digital twin” represents an effort to scale supply chain visibility to a planetary level.
Proactive Policy and Crisis Management
The primary motivation behind Global Food Twins is to move food systems knowledge from the “black box” of the private sector into a transparent, public domain. Dr. Bajaj noted that in many regions, including Canada and low-income countries, critical data on the movement of food through ports and grain elevators is proprietary and unavailable for public planning.
By bridging this data gap, Global Food Twins aims to:
● Enable Proactive Policies: Facilitate food crisis management by linking production, trade, transportation, and consumption into one unified model.
● Simulate Systemic Shocks: Allow researchers to run “what-if” scenarios, such as determining what happens to global wheat availability if a major exporter faces a severe drought.
● Promote Equity: Ensure that vital supply chain information is accessible to low-income country policymakers rather than being concentrated among high-income nations.
Methodology and Data Integration
The project functions as a prototype that integrates disparate global datasets to map the “most likely routes” for food movement across the globe. The model simulates over 13 million distinct pathways by integrating FAO production statistics, high-resolution crop maps, livestock density data and maritime/rail/road network data. The global system is broken down into 3,700 subnational regions where the model identifies what is produced and estimates the local food demand. The team utilized food balance sheets downscaled to subnational units using population-weighted data. To connect production to consumption, the model utilizes a multimodality transport models including maritime and land-based transportation network analysis. This involves running complex optimization models—often requiring 200 computational cores—to simulate millions of distinct pathways for food commodities.
Key Findings and System Vulnerabilities
Global Food Twins acts as a “proof of concept” to showcase that global food flows can be modeled and analyzed for systemic fragility. The modeling revealed a stark infrastructure vulnerability: roughly 9% of transportation infrastructure carries 80% of all food flows in certain regions. This “9/80” ratio represents a dangerous lack of diversity in the physical infrastructure. When these few “choke points” are disrupted, the entire global network of food systems face potential collapse. Preliminary findings suggest a counterintuitive trend: high-income regions often rely on a smaller, more optimized share of infrastructure for their food supply compared to low-income regions, potentially making them more susceptible to targeted infrastructure shocks.
Future Directions: Moving to Real-Time Data
While current iterations use annual data, the goal is to improve temporal resolution to allow for real-time monitoring of food flows. Dr. Bajaj emphasized a shift toward a demand-driven approach, where the project works directly with regional governments to build data products that serve their specific context-driven policy needs. All methodologies, code repositories, and model outputs remain opensource to encourage collaboration and further development by the global community.
Participant Questions and Comments
The presentation prompted an active discussion regarding the implementation and utility of these models:
● The “Black Box” of Consumption: Dr. Bajaj highlighted the difficulty of obtaining commodity-level consumption data at the provincial level, noting they had to reach out to the federal government to request proprietary scanner-level grocery store data to understand how consumption varies across provinces.
● Data Indicators and Freshness: Participants asked about the specific indicators used and how they compared to other public datasets. Dr. Bajaj clarified that FAOstat is their primary source for global production and livestock layers, noting that while no dataset is perfect, FAOstat provides the necessary consistency for global modeling. These data are self-reported by country.
● The Scale of Analysis: An attendee asked what scale of question the model is best at answering. Dr. Bajaj explained that while global models have limitations at the hyper-local level, the “Twin” can provide subnational estimates (e.g., at the county or state level) for food movement.
● Rerouting and Cost: One question addressed whether the model accounts for real-time rerouting during shocks. Dr. Bajaj clarified that the current version primarily quantifies how much total quantity is reduced or how costs increase, rather than simulating live traffic rerouting.
● Assumptions for Processed Food: Participants inquired about how the model handles processed goods. Dr. Bajaj admitted that this is a “first layer” of insight where they currently assume processed items originate from where the dominant ingredient is grown, but they are working to incorporate the location of actual processing units.
● Policy Disruptions: Another commented on the potential to use the tool to simulate “positive disruptions,” such as policy scenarios to see how they might improve the distribution of food. This has not been done, to his knowledge.
● Utility for Education and Policy: Participants noted that these tools are very useful for those trying to teach about food systems.
Dr. Bajaj concluded by offering to collaborate, emphasizing that he intends to make these data products more useful for policymakers and communities.
Chat resources shared
https://create.ace.illinois.edu/videos
https://foodsupplychain.ace.illinois.edu
https://wisconsinorganicagriculture.org
https://foodtwin.theplotline.org
https://www.fao.org/faostat/en/#country/231
https://public.tableau.com/app/profile/economic.research.service/vizzes
Biography
Dr. Kushank Bajaj is a data scientist currently working at the Food and Agriculture Organization (FAO). He earned his PhD from the University of British Columbia under the supervision of Naveen Ramankuti. His work is deeply people- and policy-centered, focusing on making complex datasets accessible to those building more just and sustainable food systems. He specializes in spatial modeling, digital twins, and the intersection of climate change and agricultural resilience.
Credits
This webinar series is made possible by the ICICLE—Intelligent CI with Computational Learning in the Environment—U.S. National Science Foundation AI Center under OAC-2112606 and organized by the University of Wisconsin-College of Agricultural and Life Sciences Center for Integrated Agricultural Systems, with support from several UW partners: the Grainger Center for Supply Chain Management, the Kaufman Lab, Center for Sustainability and the Global Environment (SAGE), Organic Collaborative, Center for Cooperatives, and the Food Studies Network.